The 60-Day Pipeline: From Funnel to Flow
Why the best sites think in weekly cohorts, not conversion rates
Every clin ops leader has stared at this dashboard: 47 patients pre-screened, 12 in screening, 2 enrolled. The numbers look healthy. Then, six weeks later…enrollment flatlines.
What went wrong? You were managing the funnel perfectly. Pre-screen → Screening → Enrollment. The conversion rates were solid. But here's the uncomfortable truth: You weren't managing a funnel. You were managing time, or rather, a “flow”.
The Pipeline Reality Check
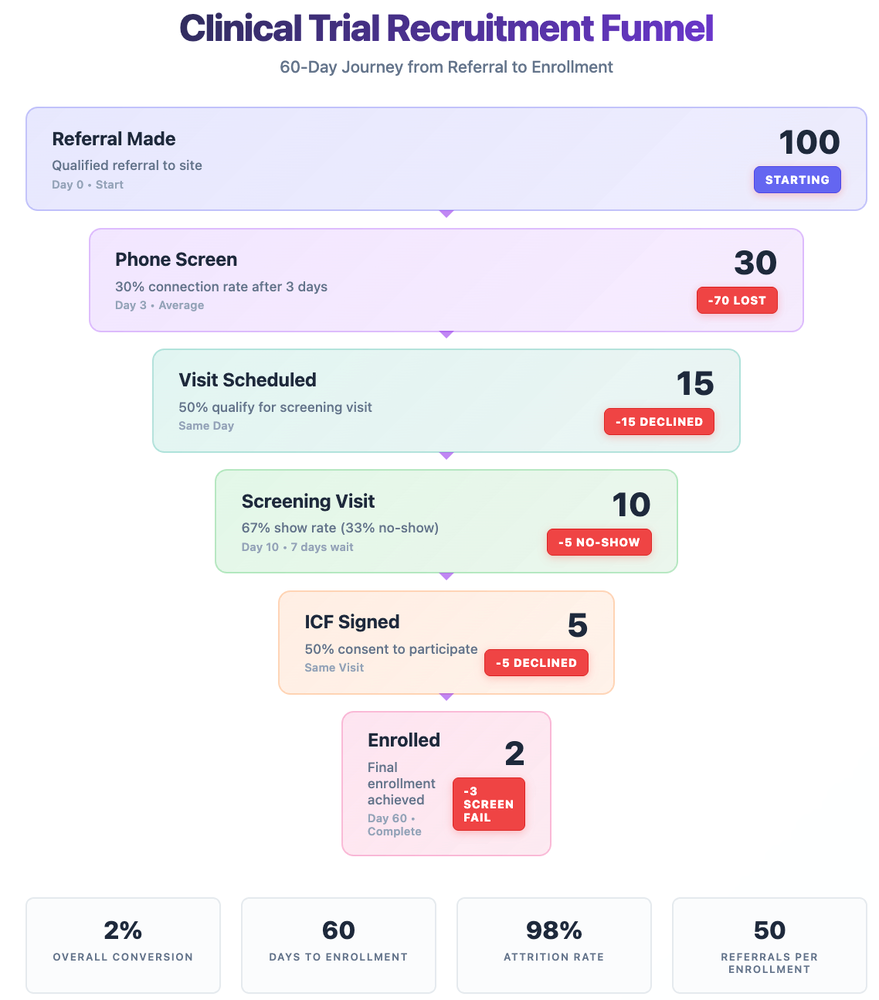
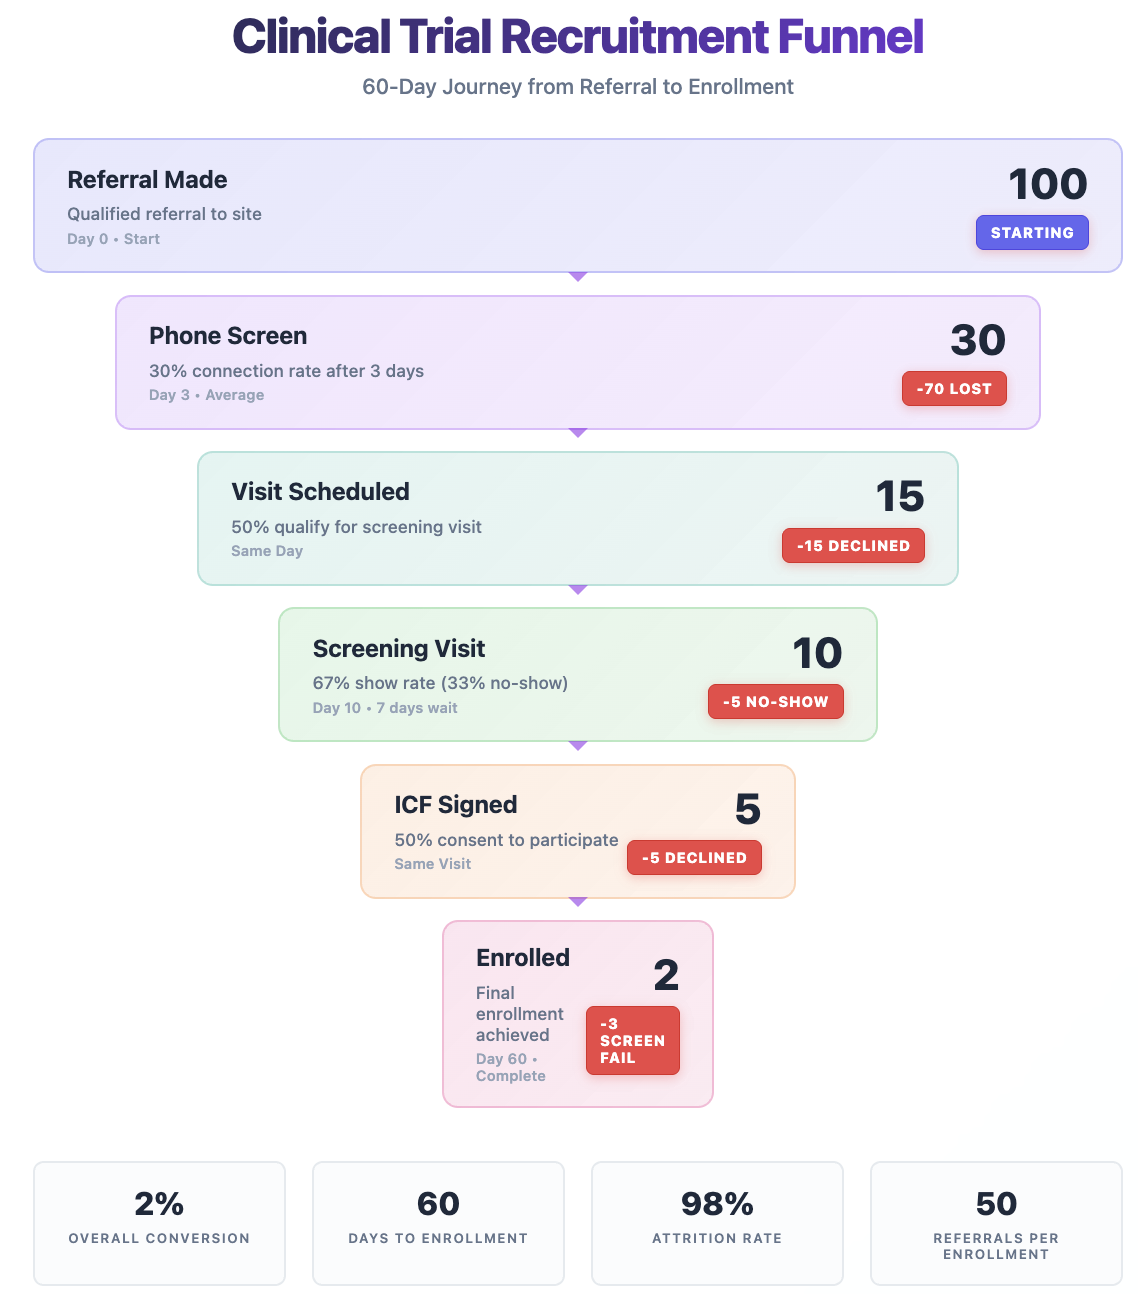
Let me show you what actually happens when 100 patients are referred to your trial:
The Brutal Funnel Math:
- 100 qualified referrals made
- 30 reach phone screening (70% never connect)
- 15 get invited to screening visits (50% of those reached)
- 10 actually show up (33% no-show rate)
- 5 sign the ICF (50% decline after learning details)
- 2 enroll after screening period (60% screen fail)
That's a 2% conversion rate. But here's what kills enrollment: This process takes 60 days.
Each cohort moves through your pipeline like a slow-motion train:
- Days 0-3: Site attempting phone contact
- Day 3: Phone screen and booking (if successful)
- Days 3-10: Waiting for screening visit
- Day 10: Screening visit and ICF signing
- Days 10-50: 4-6 week screening period (labs, scans, washouts)
- Day 50-60: Final enrollment decision
Miss a week of new referrals? That's an empty train car arriving at enrollment 60 days later.
Breaking Down the 60-Day Journey
Let's get specific about what happens at each stage, because terminology matters:
Pre-screening (Days 0-10): Everything before the ICF
- Phone calls, initial qualification
- Medical record reviews
- Prescription history
- Scheduling logistics
- This is where 85% of your attrition happens
Screening (Days 10-50): Post-ICF medical verification
- Protocol-specific assessments
- Blood work, imaging, measurements
- Washout periods
- Another 60% of remaining patients fail here
Enrollment (Day 50-60): The discrete event
- Final eligibility confirmation
- Randomization
- First dose/intervention
The critical insight: You're not managing one funnel—you're managing multiple overlapping 60-day journeys.
The Weekly Cohort Reality
Let’s examine what the view would look like in a more “cohort” or “flow-based” view:
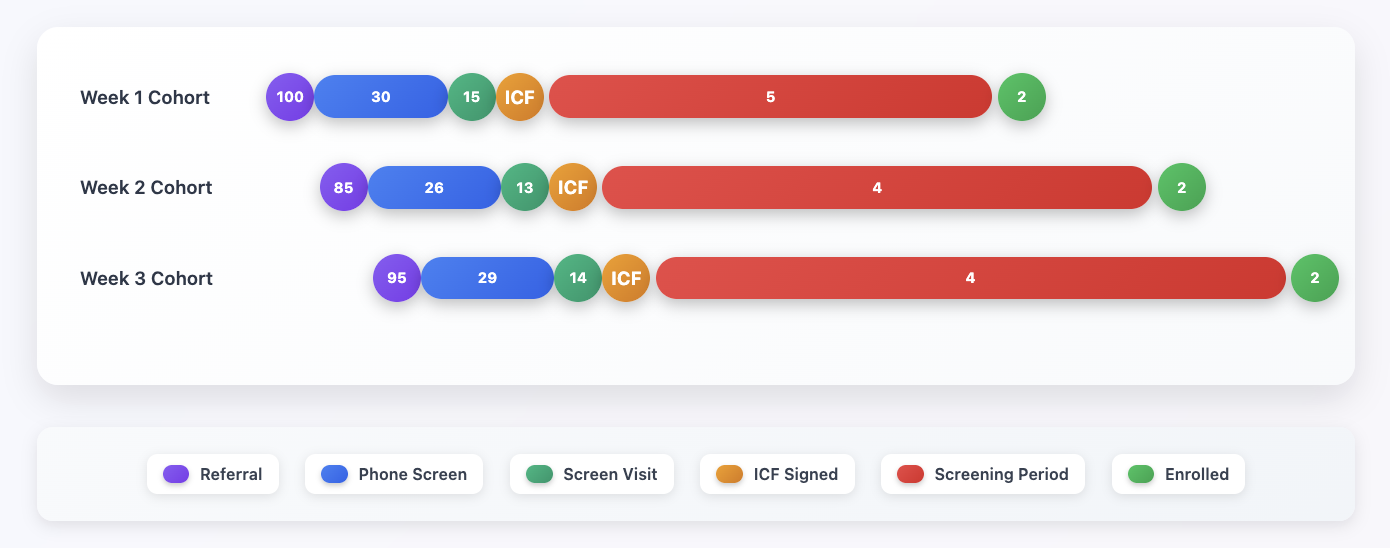
Notice the overlap? By Week 3, you have cohorts at every stage simultaneously. This is why consistent weekly flow matters more than big recruitment pushes.
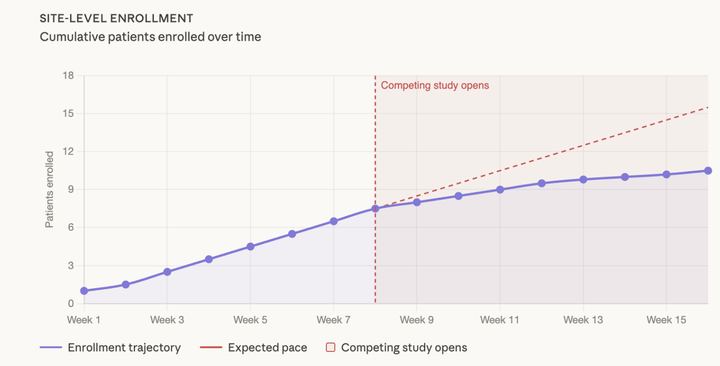
Why Sites Hit the Wall at Month 3
Remember that enrollment plateau from last week's article? Now you see why it happens:
- Month 1: Sites enroll their known patients (no 60-day wait)
- Month 2: First recruitment cohorts complete their journey
- Month 3: The pipeline runs dry if you didn't maintain flow
Most sites don't realize they need 100 referrals in Week 1 to get 2 enrollments in Week 8. They celebrate early wins, ease off recruitment, then wonder why enrollment crashes two months later.
The Patients in Process (PIP) Metric
Work backwards from your accrual targets. If you want to enroll 10 patients/month, calculate how many patients you need actively moving through your pipeline:
Pipeline Math:
- Target: 8-10 enrollments/month
- Typical conversion rate: 2-5% (screening to randomization)
- Required PIP: 200-500 patients in process at any given time
Healthy Pipeline Distribution:
- 150-200 in pre-screening (Week 1-2)
- 80-120 awaiting screening visits (Week 2-3)
- 40-80 in screening period (Week 3-8)
- 15-30 approaching enrollment
🟠 Warning Signs: PIP drops below 50% of target → 🚨 Crisis Mode: PIP drops below 25% of target
Calculate Your Site's PIP Threshold:
- Set monthly enrollment target (e.g., 8 patients/month)
- Estimate your conversion rate (e.g., 3%)
- Required PIP = Target ÷ Conversion Rate (8 ÷ 0.03 = ~267 patients)
- Add buffer for pipeline stability (+50% = ~150 patients minimum PIP)
Power's Pipeline Approach
At Power, we learned this the hard way. Sponsors would be used to a big campaign with 1000 referrals all at once. But sites would quickly find themselves underwater.
The problem wasn't the referral quality—it was the timing of the referrals.
This insight transformed how we think about recruitment. Now we follow four key principles:
1. Constant Flow, Not Campaigns
- 5-25 new referrals every week
- Sites can process this volume while managing shorter backlogs
- Measure patients in process by cohort
- Predictable enrollment 8 weeks later
2. Dynamic Volume Allocation: We don't send every site exactly 25 referrals. Sites with more capacity might get 40/week, while others get 5 until they want to handle more. We adjust weekly based on every site’s capacity, response times, conversion rates, and current backlog depth - ensuring every referral goes where they have the highest chance of meeting a study team that is ready to receive them.
3. Pipeline Transparency We show sponsors exactly where each cohort sits per site:
- Week 1 cohort: 23 patients in phone screening
- Week 3 cohort: 8 patients scheduled for visits
- Week 6 cohort: 4 patients completing screening
- Week 8 cohort: 2 approaching enrollment
4. Early Warning System When PIP or projected enrollments drop below the target threshold, we start a root cause analysis – to understand if we need more site engagement, a different mix of referrals, or more overall. But remember—the impact won't show for 60 days. That's why monitoring matters.
Building Your 60-Day Forecast
Want to predict next few month's enrollment? Look at what entered your pipeline 30-60 days ago:
Simple Forecasting Model:
- Patients who signed ICF 4-6 weeks ago × 40% = likely enrollments
- Patients with screening visits booked 6-8 weeks ago × 20% = likely enrollments
- New referrals today × 2% = enrollments in 60 days
Track variance by site and indication. Oncology trials might need many more referrals per enrollment. Rare disease trials might convert at 5%. But the 60-day timeline remains remarkably consistent.
Your Action Plan
Week 1: Map Your Current Pipeline
- Count every patient by stage and entry date
- Calculate days spent at each stage
- Identify your true* PIP number (*based on weekly cohorts)
Week 2: Implement Weekly Tracking
- Create cohort tracking spreadsheet
- Mark entry dates for each batch
- Set up 60-day forward projections
Week 3: Establish Flow Targets
- Calculate referrals needed for enrollment goals
- Divide by 4 for weekly targets
- Never skip a week (empty train cars = future zeros)
Week 4: Build Early Warning Dashboard
- PIP by stage
- Weighted projected enrollments metric
- Cohort progression rates
- 60-day enrollment forecast
The Bottom Line
Stop thinking about recruitment as a funnel. Think of it as a process flow with a 60-day resolution cycle. Every week you don't add to the flow on the front end, you're guaranteeing an empty output 60 days later.
The sites crushing their enrollment targets aren't lucky. They're not spending more. They just understand the time game: Today's phone screens are next month's enrollments.
Most importantly, they never forget the math: 100 referrals → 30 phone screens → 15 invitations → 10 visits → 5 ICFs → 2 enrollments. Over 60 days. Almost like clockwork.
Brandon Li is Co-Founder at Power, where we've helped sites manage recruitment pipelines for 600,000+ patients. The 60-day framework transformed how we think about enrollment—from reactive firefighting to predictive pipeline management.
Comments ()