The ROI Reality Check: Three Financial Levers To Quantify Your Patient Recruitment Investments
Why clin ops’ leaders who understand these metrics never question recruitment budgets again
Last month, I sat in on a biotech budget review where the CFO asked the VP of Clin Ops: "Why should we invest in recruitment firms when we could just rely on sites?"
The VP's response was immediate: "Because the alternative would cost us millions more."
She was right. But here's what struck me: most people in clin ops don't have the ROI framework off the top of their heads. They know recruitment delays are expensive, but they don't know the specific financial mechanics that make external recruitment one of the highest-ROI decisions in clinical trials.
After working with hundreds of trial budgets, I've identified three financial levers that drive patient recruitment ROI. Once you understand these, the math becomes undeniable.
Note if you want a model to use for your own trial, you can simply email me at brandon@withpower.com.

Lever 1: Direct Cost Avoidance from Timeline Extension
The most immediate and understandable lever: avoiding the monthly burn rate of extended trials.
The operational reality: Every clinical trial has a monthly burn rate… site costs, CRO fees, monitoring, data management, safety reporting. When enrollment extends, these costs continue relentlessly.
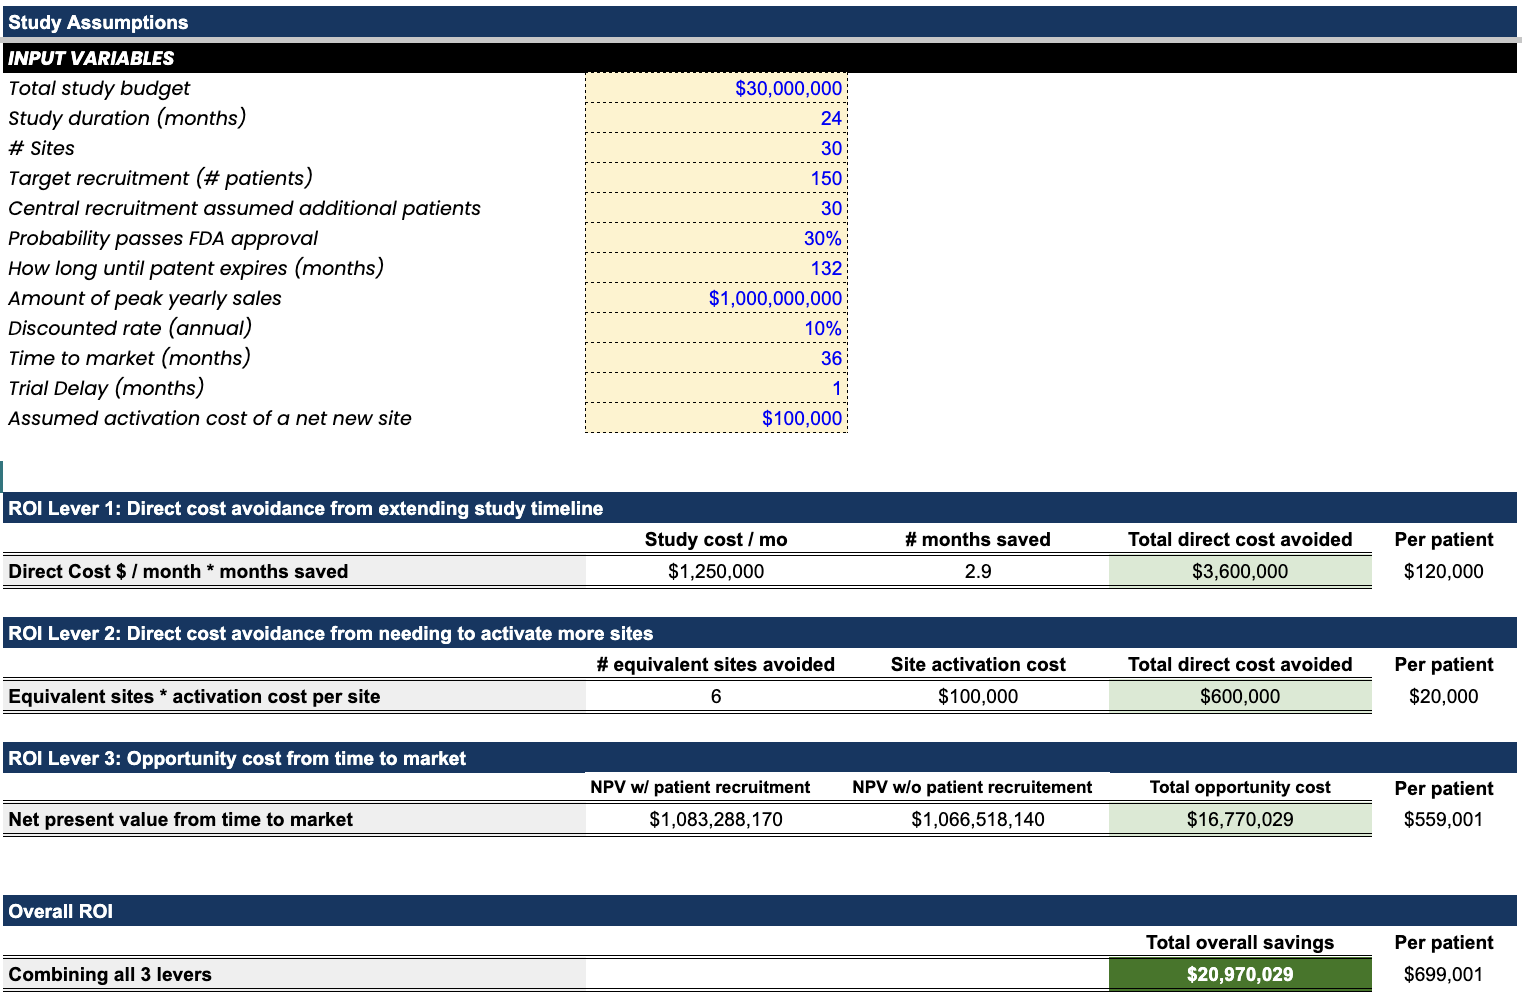
Real example from a 150-patient neuroscience trial:
- Monthly trial operational cost: $1.5M
- Timeline extension without recruitment: 2.4 months
- Direct cost avoidance: $3.6M
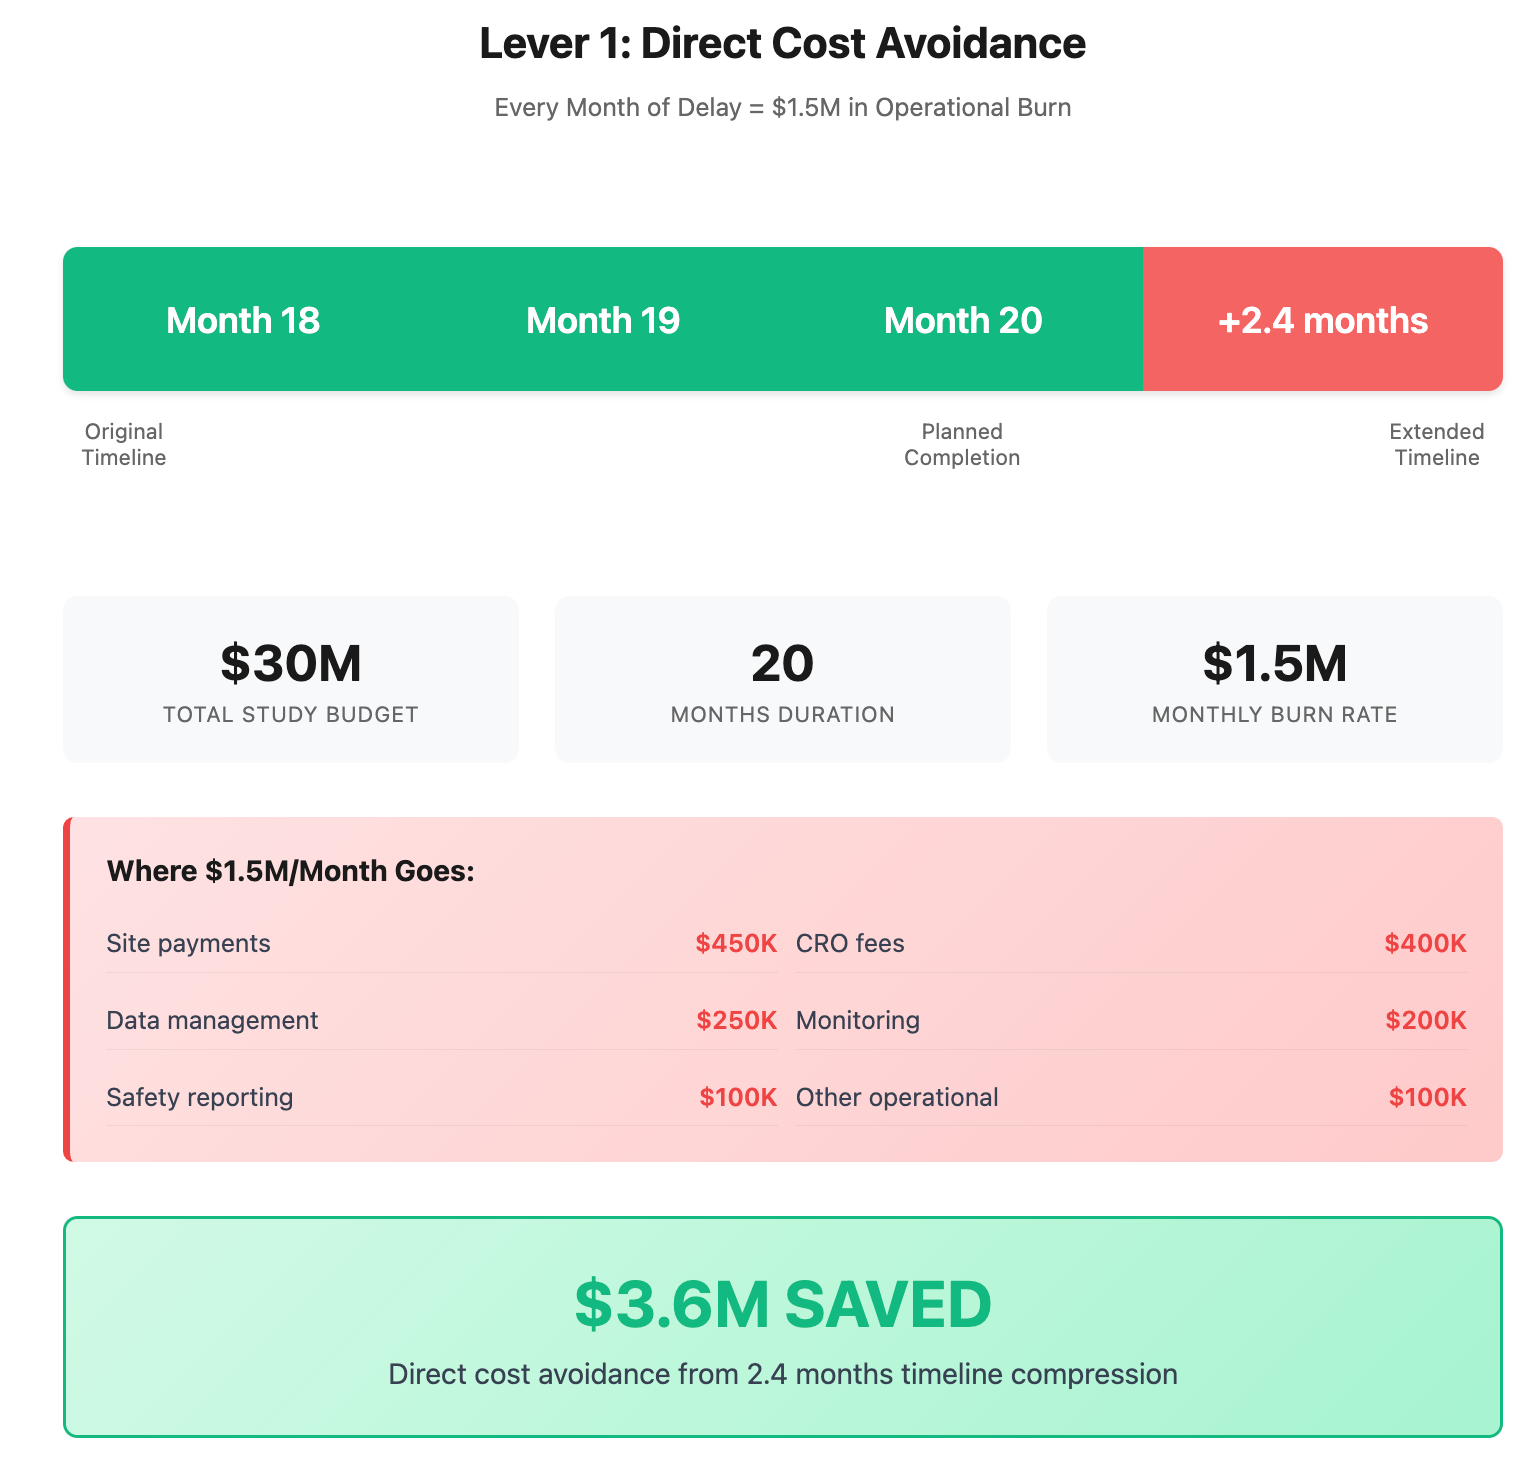
When a recruitment partner prevents 2.4 months of delay, they're saving you $3.6M in direct operational costs. Scale that to a typical 3-4 month delay? You're looking at $4.5-6M.
What this means operationally: Most trials experience enrollment delays. The direct cost of these delays is often the most tangible and immediate financial impact that CFOs understand. Unlike opportunity costs or risk calculations, this is real money saved.
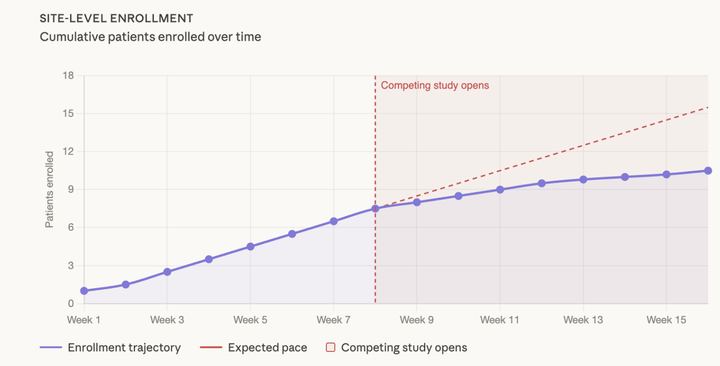
See our previous newsletter on analyzing patients in weekly cohorts to spot these delays sooner.
Lever 2: Site Activation Cost Avoidance
The second lever is avoiding the cascade of additional site activations that inevitably happen when enrollment stalls.
The site activation reality: Most clin ops teams plan for 60-80% site performance. Reality is closer to 40-60% (we track this across 500+ sites & the median is 52%). When enrollment targets aren't met, the instinctive response is adding more sites.
The compound effect:
- Each new site costs $50K-$150K to activate
- Sites added at month 6 don't enroll until month 9
- You're now paying for underperforming original sites AND new rescue sites
- Your timeline extends further, triggering more Lever 1 costs
Real-world example: Instead of activating 8 additional sites at $100K each ($800K total), understand the equivalent site productivity of external recruitment.
For our 150-patient trial:
- Recruitment firm enrolls: 30 patients
- Equivalent site productivity: 6 sites avoided
- Cost per site activation: $100,000
- Site cost avoidance: $600,000
This shows how recruitment creates value through both cost avoidance and timeline protection.
Lever 3: NPV Impact from Time to Market
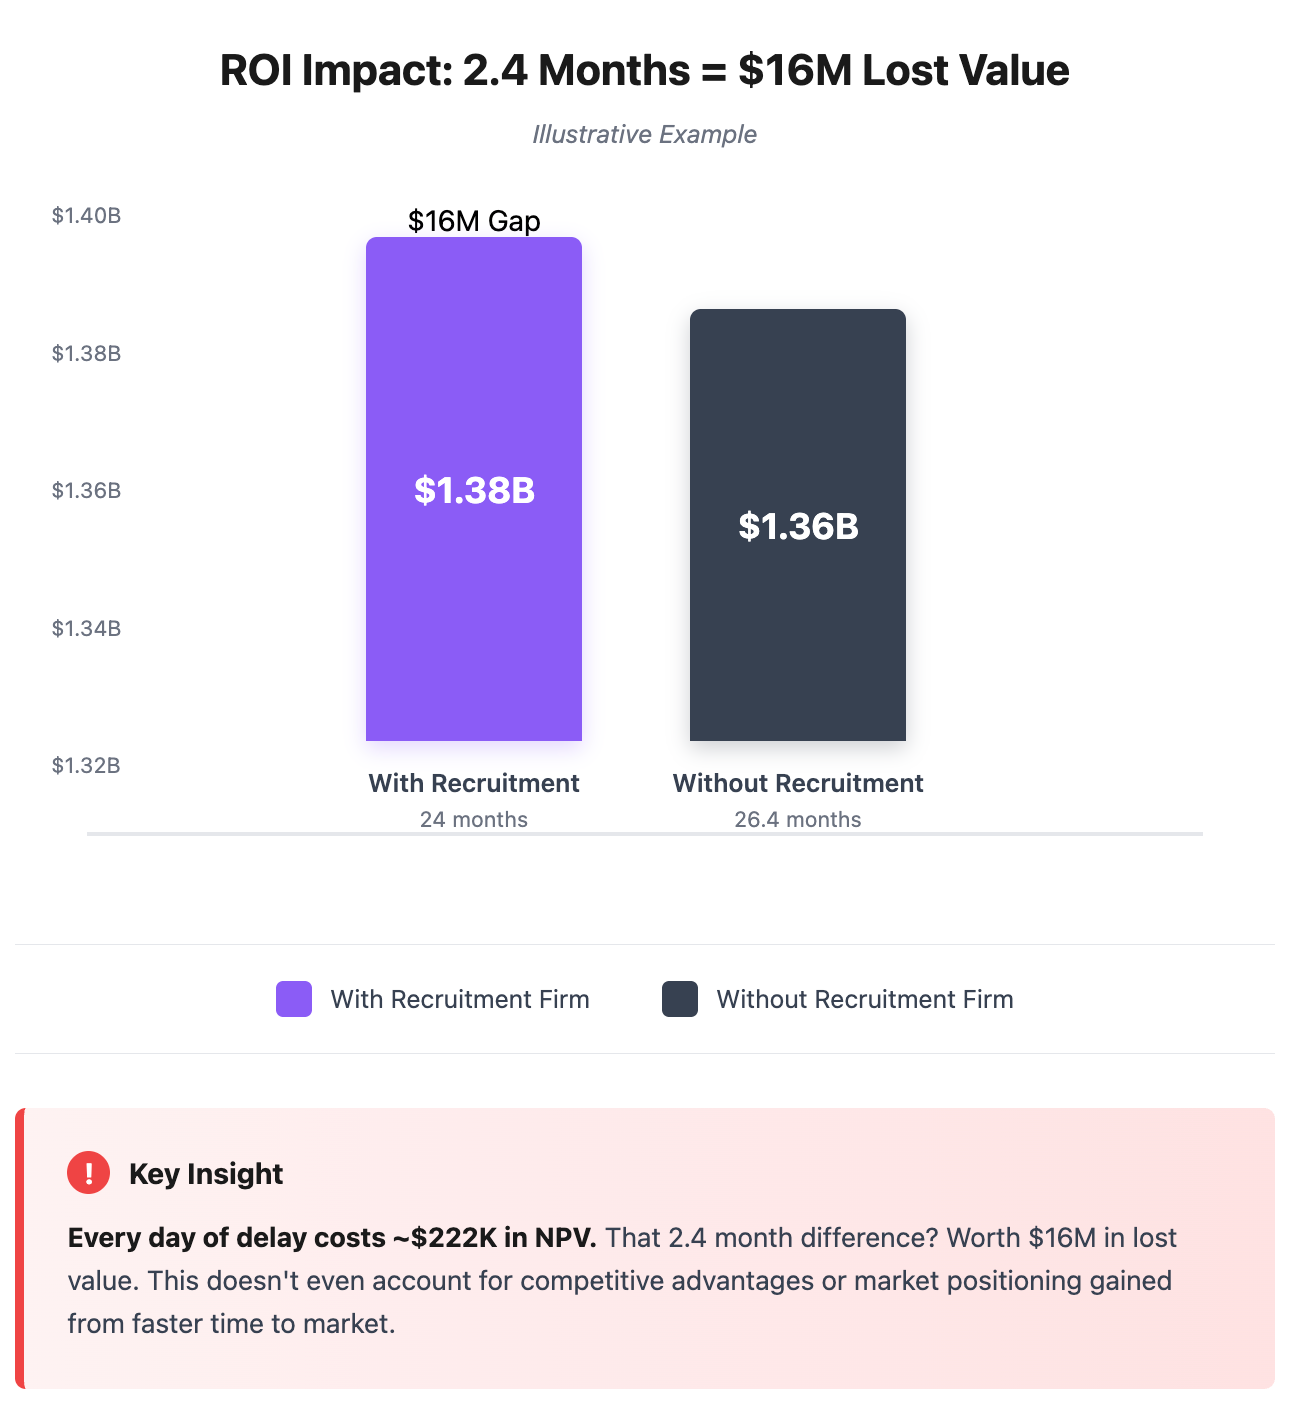
The most powerful but often dismissed lever: the massive NPV impact of market entry timing.
The DCF reality: When you build a proper discounted cash flow model for a clinical program, every month of delay has compounding financial impact.
Take a typical neuroscience program:
- Peak annual revenue: $1B
- Patent life remaining: 132 months
- FDA approval probability: 30%
- Discount rate: 10% annually
The timeline math:
- 24 months to market: $1.39B program NPV
- 26.4 months to market: $1.38B program NPV
- NPV difference: $16M lost value
That's $222K in value destroyed per day of delay. Every single day. Including weekends. That's more than most sites enroll in a year, evaporating daily.
Why finance teams dismiss this: CFOs may often dismiss NPV calculations as "too theoretical." But even if you discount these projections by 50%, the directionality remains clear: faster trials create exponentially more value. And for programs with higher peak sales, this lever becomes even more powerful.
The Compound ROI Effect
Here's where it gets interesting: these three levers don't just add together. They multiply.
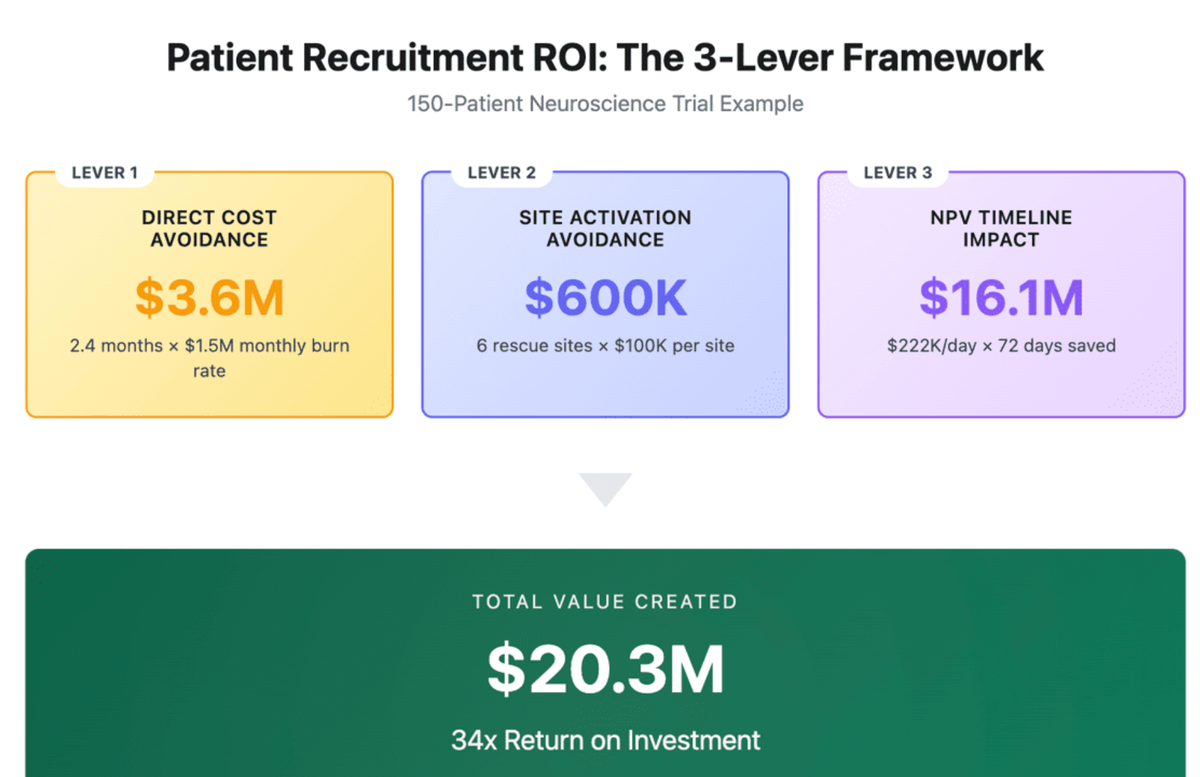
Example: 150-patient neuroscience trial
- Direct cost avoidance: 2.4 months saved = $3.6M
- Site cost avoidance: 6 sites avoided = $600K
- NPV timeline value: 2.4 months acceleration = $16.1M
- Total value created: $20.3M+
Against a recruitment investment of 30 patients × $20K = $600K, that's a 34x ROI.
But the real insight is leverage: the larger your program value, the higher the ROI on recruitment acceleration. For programs with higher peak sales projections, the same timeline acceleration creates proportionally more value.
As stated above, we have an ROI model you can leverage to input your own assumed variables to see what the true ROI is across each of these three levers:
If interested in playing with it yourself, you can simply email me at brandon@withpower.com and I’ll send it your way!
The Hidden Risk Premium
Here's what most ROI models miss entirely: risk mitigation.
All three levers above assume you eventually succeed. But what if you don't? The cost of trial failure? Your entire $30M investment goes to zero.
Professional patient recruitment isn't just patient finding. It's risk transfer. When you engage a specialized firm, you're buying:
- Performance predictability (or the "Predictive Enrollment Methodology" we leverage at Power): Higher success rates in hitting enrollment targets
- Backup capacity: If sites underperform, recruitment can scale up
- Expertise: Therapeutic area knowledge prevents protocol-specific failures
When professional recruitment improves success probability by even 20%, that's $6M in risk-adjusted value…on top of the $20.3M in direct value creation.
This risk mitigation is a concluding thought: all of these levers are just ways that you are investing in mitigating risk. The cost of these risks is sky high. Then, let's use the idea of a predictable enrollment methodology to evaluate whether you "believe the impact" that a recruitment partner is presenting to you.
Why Smart Clin Ops Leaders Model This
The best clin ops teams have internalized these calculations. They don't see recruitment as a variable cost to minimize. They see it as program insurance to maximize.
How they think about it:
Old mindset: "Recruitment costs too much compared to internal site efforts"
New mindset: "External recruitment saves significant program risk and delay costs"
Old question: "How do we reduce recruitment costs?"
New question: "What's the maximum we should pay to guarantee enrollment?"
Old metric: Cost per randomized patient
New metric: NPV created per recruitment dollar
What This Means for Your Next Budget Review
Next time finance questions recruitment costs, don't defend the line item. Show them the three levers:
- Direct cost avoidance: Every month saved prevents millions in operational burn
- Site cost avoidance: Each recruited patient prevents thousands in additional site costs
- NPV acceleration: Timeline compression creates exponential program value
The combined effect makes external recruitment investments look like the high-ROI decisions they actually are.
Because when you understand the financial mechanics, recruitment isn't an expense. It's one of the highest-ROI investments in your entire clinical program.
Brandon Li is Co-Founder at Power, where we've helped generate significant additional program ROI through accelerated recruitment timelines across neuroscience and other therapeutic areas over the past 4 years.
Comments ()